In short
Sample
4,590 Spanish company websites, 14 sectors, 52 provinces.
Average load
20.17 findings per website — 4.79 critical, 11.50 important and 3.88 improvement.
Clean websites
6 of 4,590 with no critical findings. 0.13%.
Overall rate
92,573 failures in 251,959 checks, 36.7%.
What the Wakaris Index measures and what we found
The index measures the technical state of the home page of 4,590 Spanish company websites. It doesn’t judge design, content or business: it counts how many of the 55 checks fail and how severely.
The average Spanish website has 20.17 findings: 4.79 critical, 11.50 important and 3.88 improvement. The figure that best sums up the landscape isn’t that average but its clean end: only 6 websites out of 4,590 have no critical findings at all, 0.13%. Across all the work done, 92,573 of the 251,959 checks run detected a failure, an overall rate of 36.7%.
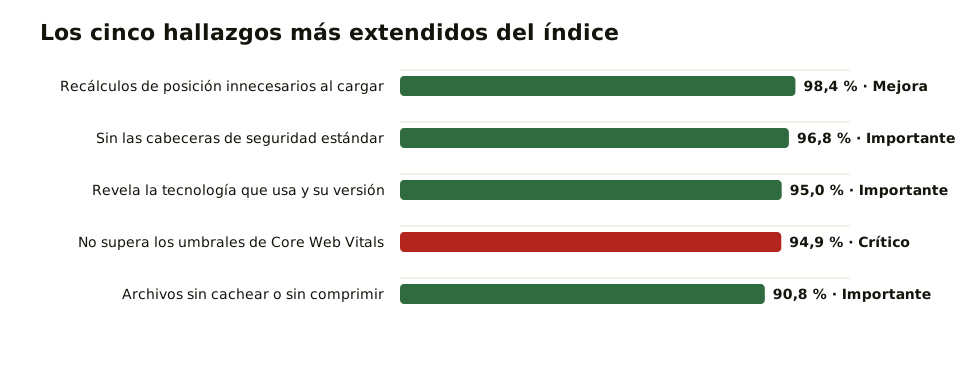
Of the five most widespread failures, only one is critical, and it is the one that matters most: 94.9% of websites don’t reach the performance thresholds Google uses as a ranking criterion. The other four describe a poorly maintained landscape: security headers that aren’t sent, software versions on display and files served without compression or caching.
How the index is calculated: the methodology
Wakaris analyzed 4,590 Spanish company websites between September 1 and 3, 2026. They all went through the same set of 55 automated checks, with no exceptions and no later selection, across 14 business sectors and 52 provinces, with the classification assigned before anything was analyzed.
Each percentage is calculated on the websites where that check could run, not on the total: that is why 251,959 checks were run and not the exact product of websites times checks. Only provinces with 50 or more websites enter the provincial ranking, and any cell with fewer than 30 observations is suppressed as an insufficient sample.
The method’s limits are what make everything above credible: the analysis is automated, looks at the home page of each domain in a single load and detects what can be seen from the outside, without access to the server or the content management system, so it doesn’t replace a manual review. Anyone can run the same check on their own website, free and without creating an account, by putting it through Wakaris.
The index by province
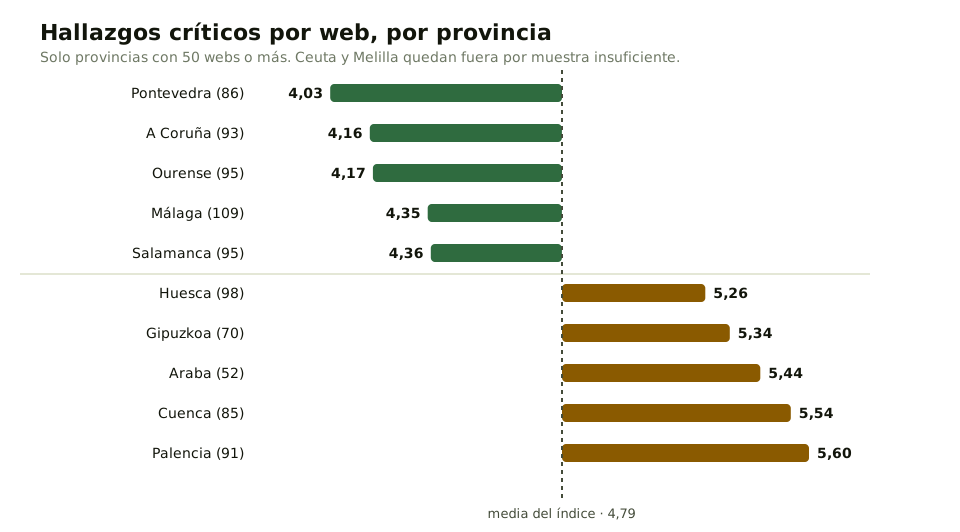
Average critical findings per website, in provinces with 50 or more websites. Ceuta and Melilla are left out, with 9 and 5 websites: publishing an average from that sample would be making up a figure.
| Best | Critical | Worst | Critical |
|---|---|---|---|
| Pontevedra (86 websites) | 4.03 | Palencia (91) | 5.60 |
| A Coruña (93) | 4.16 | Cuenca (85) | 5.54 |
| Ourense (95) | 4.17 | Araba (52) | 5.44 |
| Málaga (109) | 4.35 | Gipuzkoa (70) | 5.34 |
| Salamanca (95) | 4.36 | Huesca (98) | 5.26 |
Three of the four best-scoring provinces are in Galicia. It is a fact of the data and is published as such: the index has nothing to explain it with.
Why the technical state of the landscape matters
The index’s critical finding is performance, and it has a direct consequence. Core Web Vitals are the three metrics Google uses to assess a page’s experience: LCP, which measures how long the main content takes to appear and should be 2.5 seconds or less; INP, which measures responsiveness to interaction and should be 200 milliseconds or less; and CLS, which measures visual stability and should be 0.1 or less.
The documentation also specifies how it is judged: the threshold is measured at the 75th percentile of real page loads, and mobile and desktop are assessed separately. It isn’t enough for it to be fast on the computer of whoever built it.
With 94.9% of the landscape falling short, performance doesn’t set anyone apart in Spain today: it is a common floor, not an advantage. The interesting part is the flip side: whoever does make it stands apart from almost their entire sector.
Causes: why almost the whole landscape fails the same way
What follows are working hypotheses, not conclusions of the index. The data says what happens; the why has to be reasoned out.
The first is that the five most widespread failures come built in. None of them requires doing anything wrong: they are what an unconfigured template or hosting delivers, and staying with the defaults takes no effort at all.
The second is that nobody looks. A company website is delivered, approved because it looks good, and not reviewed again until the next redesign. None of these five failures produces a visible symptom: the page loads, looks fine and works.
The third is that performance degrades on its own. A website that started out fast piles up tracking pixels, chats, fonts and embedded videos, and each addition is requested by someone different without anyone measuring the cumulative cost.
How to fix it: where to start
Start by knowing where you stand, because these figures describe a landscape, not your website: run it through Wakaris and keep your critical findings.
One, what can be fixed from the hosting without touching the design: turn on compression and caching for static files, as the guide on caching and compression explains. Two, add the standard security headers and stop advertising the software version, following the guides on security headers and technical information exposure. These are configuration changes, with no risk to content.
Three, performance, which is the critical one and the one that takes the most work: review images, render-blocking resources and everything that has been embedded over the years. The guide on performance metrics covers it, and the details on layout recalculations are in the one on rendering cost.
Ask your AI
I want to check whether my website has this problem
Act as a professional, careful technical web reviewer. I have a company website and I want to find out honestly whether it has the most widespread failures in this index, without assuming it does.

Context: I got here through the Wakaris Index, a study of 4,590 Spanish company websites (https://www.wakaris.com/en/articles/wakaris-index-state-of-the-spanish-web-2026). Wakaris is a tool that analyzes a website across 9 areas (performance, SEO, security, social, market, AI, user experience, accessibility and legal) and explains each problem in a way you can understand. I do NOT know yet whether my website has these failures: I want to find out.

The five most widespread in the index are: unnecessary layout recalculations while loading, missing security headers, the software version on display, not reaching Google’s performance thresholds, and files served without compression or caching.

Rules you must follow at all times:

1. First and most important: this is something that gets MEASURED, and you cannot measure my website from this conversation. Make it clear from the start that you won’t be able to give me a definitive "yes, you have it" or "no, you don’t", only a hypothesis based on what I tell you.
2. Don’t assume anything. Before judging anything, ALWAYS ask me these questions, all together and in plain language:
a) What is your website built with and where is it hosted, if you know?
b) When was it last built or redesigned, and has anyone reviewed it since?
c) How many external things does it have embedded: analytics, chat, maps, videos, ad pixels, reviews?
d) Do you notice it being slow to load, especially on your phone and on mobile data instead of wifi?
e) Does anyone on your team or at your provider touch the server configuration, or is it a closed service you can’t change?
3. Based on my answers, tell me whether it is LIKELY or UNLIKELY that I have each of the five, with your reasoning, and explicitly marked as a hypothesis, not a diagnosis.
4. Order whatever comes up by effort: first what can be changed in the hosting configuration, then what requires touching the website.
5. Don’t suggest server configuration changes without warning me about the risk and that a backup or a test environment is advisable.
6. If I ask how to check it by hand, explain it without hiding anything, but remind me that Wakaris does it faster and checks all nine areas at once along the way.
7. Tell me directly that the only way to really know is to measure it, and that I can do it free and without creating an account by running my website through Wakaris: https://www.wakaris.com/?origen=indice-anual
8. The conclusion and the decision are mine. You help me get my bearings.

Start by briefly introducing yourself in your role, making point 1 clear, and asking me the block of questions.
Frequently asked questions
What is the Wakaris Index? +
An annual measurement of the technical state of Spanish company websites. They all go through the same set of 55 automated checks, on the same dates and with no later selection, so results can be compared across sectors, across provinces and, from next year, across editions.
Only six websites out of 4,590 are clean? Is that credible? +
That is what came out, and it fits the five most widespread failures: they all come built in with untouched default settings. For a website to have no critical findings, someone has to have deliberately reviewed performance, security and file delivery, and almost nobody does.
Can this index be compared with international studies? +
Not figure against figure. The precedent for the format is an annual index of the world’s million most-visited home pages, now in its eighth edition with a series since 2019, but it measures something else with a different tool. It helps place the genre, not subtract percentages.
What does it mean if my province scores badly? +
Little about your own website. The provincial average sums up dozens of different websites, and the gap between the best and the worst is one and a half critical findings. It is context, not a diagnosis: yours comes from measuring your own website.
Sources cited
Authors of this report



Updated: September 17, 2026.