In short
What’s measured
LCP (loading speed), CLS (visual stability) and TBT (responsiveness).
Good values
LCP of 2.5 seconds or less, CLS of 0.1 or less, TBT under 200 milliseconds.
Why it matters
Google states that it uses the Core Web Vitals in its ranking systems.
Severity in Wakaris
Critical. It’s the most common finding: it fails on 96% of the pages analyzed.
What this finding is and what it measures
This finding appears when any of your page’s three performance metrics falls outside its threshold. Each one looks at something different, and it’s worth not mixing them up.
LCP, or Largest Contentful Paint, measures the time until the largest visible element on the page is shown, usually a featured image or a main block of text. It’s the moment the page looks loaded.
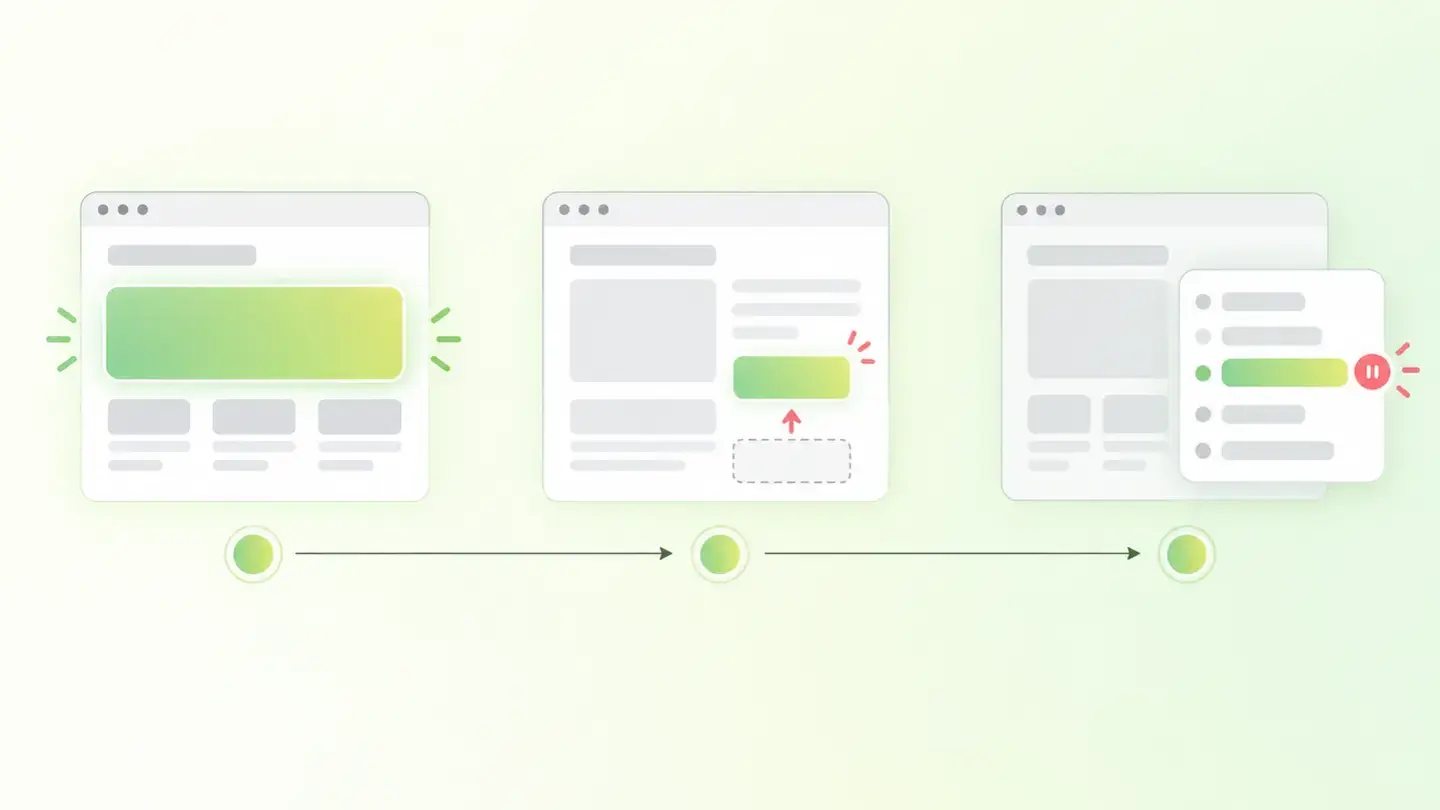
CLS, or Cumulative Layout Shift, measures how much content moves around without anyone asking it to: the button that shifts just as you’re about to tap it. It’s not a time but a score, calculated by multiplying the share of the screen affected by the distance it moved.
TBT, or Total Blocking Time, measures how long the browser was too busy to respond. It adds up the long tasks, those over 50 milliseconds, counting only the time beyond those 50 milliseconds.
How it’s measured
Wakaris measures all three on the URL you give it and returns the value of each, the threshold it misses and the severity of the finding, with nothing to install. That’s the direct way to know where you stand.
One detail changes how you read the numbers. There are three Core Web Vitals: LCP, INP and CLS. INP, which measures responsiveness to interactions, needs a real person interacting, so no automated measurement can get it. TBT is used instead as its lab substitute: Google’s documentation describes it as a proxy for INP. That’s why Wakaris measures LCP, CLS and TBT, not INP.
The other distinction is between lab and field data. Wakaris loads your page under controlled conditions, which is what you need to analyze and to check whether a fix worked. Field data aggregates your visitors’ real page loads, and it’s what Google uses to assess page experience: it sets the threshold at the 75th percentile of those loads and separates mobile from desktop. Passing on desktop and failing on mobile is the norm.
Why it matters
It matters on two fronts, and it’s worth weighing each one precisely.
The first is the experience of whoever visits. The longer the main content takes to appear, the more likely they are to leave before seeing it. If content moves while loading, people tap what they didn’t mean to tap. And if the browser is blocked, the page seems broken even though it looks complete.
The second is SEO, and here you have to be precise so as not to overpromise. Google states in its documentation that the Core Web Vitals are used by its ranking systems. But it adds something just as important: search always tries to show the most relevant content, even if the page experience is mediocre, and a good experience contributes to success mainly when lots of useful content is competing for the same query. Put plainly: good performance won’t rescue weak content, but poor performance can hold back a page that’s otherwise excellent, and it holds it back more the more competitive the search.
Common causes
The three metrics fail for different reasons, and knowing that is the first step to not wasting time.
Behind a high LCP there’s almost always one of these four: a slow-responding server, heavy images or inefficient formats, render-blocking resources the browser must process before drawing anything, or a page that depends on JavaScript to build its own content.
Behind a high CLS are images and videos without declared dimensions, which push down whatever is below them when they appear; ads, iframes and notices inserted on the fly; and web fonts that change the text size when they load and reflow entire paragraphs.
Behind a high TBT there’s a single family of culprits: JavaScript that holds the main thread for too long at a stretch. It usually comes from large libraries loaded in full to use just one part, third-party code such as analytics and advertising tags, and heavy work done all at once instead of split into chunks.
How to fix it
The first thing is to know which of the three is failing and why, because the fix is completely different for each. In the report, Wakaris shows you which metric is outside its threshold and by what value, which is where any sensible decision starts.
For LCP, in order of effort versus payoff: serve images at their real size and in modern formats, mark the main element so the browser prioritizes it, remove or defer render-blocking resources, and only then work on the server.
For CLS the fix is almost mechanical and usually the most worthwhile: declare width and height on all images and videos, reserve space in advance for anything that will be inserted later, and avoid inserting content above what’s already being read.
For TBT, split long tasks into chunks, load only the code needed for the first render, and check what each third-party tag adds. Don’t look for a single tweak that fixes everything.
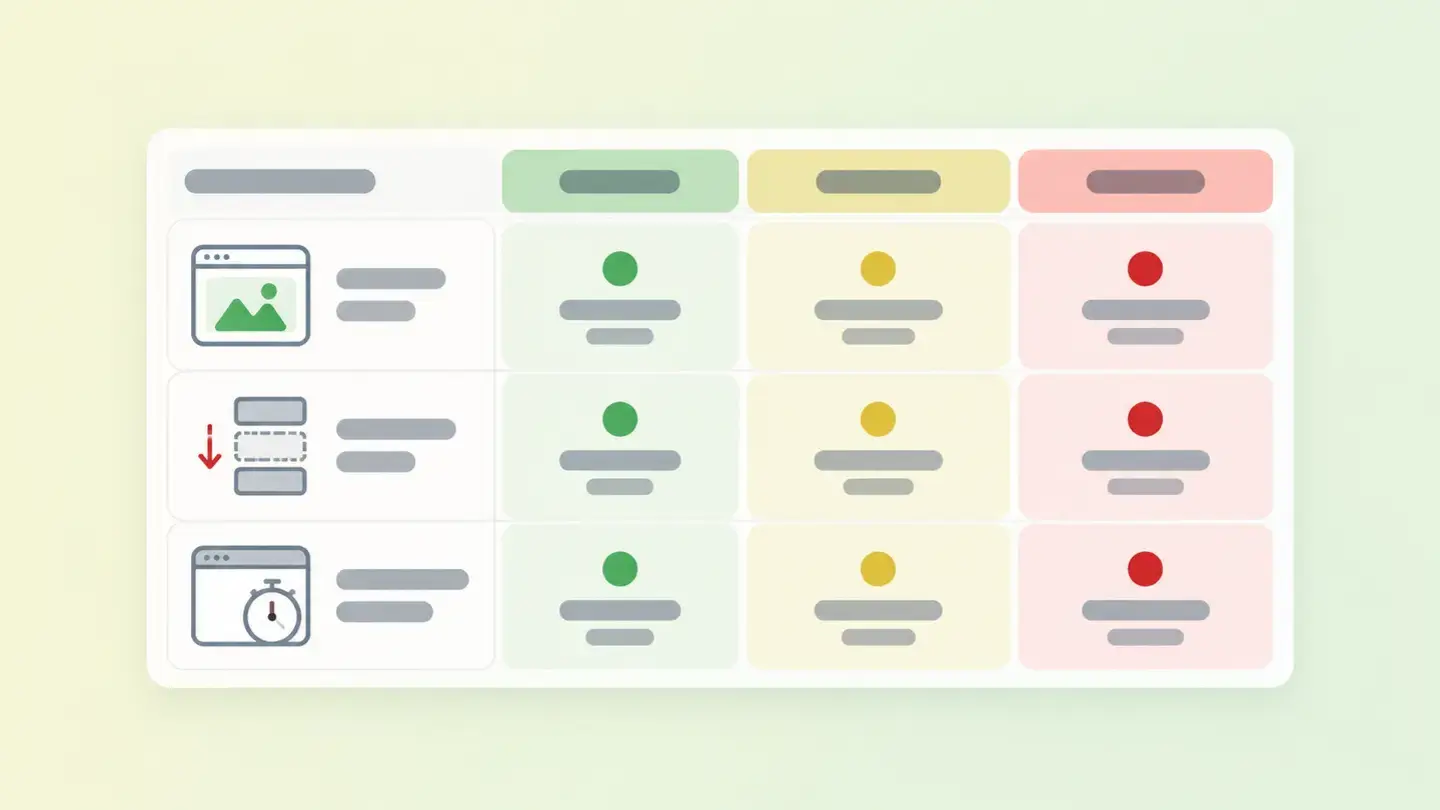
Table with the LCP, CLS and TBT thresholds, separating good, needs-improvement and poor values
Brief to generate the image
Editorial illustration for a Wakaris technical guide.
Topic: Table with the LCP, CLS and TBT thresholds, separating good, needs-improvement and poor values.
Style: white background with a soft lime→pale green wash (#F8F7D6 → #E2F2DC), green→lime gradient accent (#8ED390 → #DCD86F), near-black ink (#12150B), pill shapes and rounded corners, soft shadows, clean schematic look, no photography.
Format: 16:9, 1440 pixels wide.
No legible text: any label, code or figure is shown as gray placeholder bars. The caption carries the meaning, not the image.
No real logos or third-party brands. No recognizable people.
Tags: metrics, performance, table, thresholds, lcp, cls, tbt, separating
Ask your AI
If you want to dig into your specific case, copy one of these two prompts and paste it into the AI you use. Choose based on your situation.
I’ve already measured the finding with Wakaris and want to fix it
Act as a professional, careful web technical consultant. Your goal is to help me understand a specific finding about my website and decide what to do about it, without making anything up.

Context: I got this finding from Wakaris, a tool that analyzes a website across 9 areas (performance, SEO, security, social, market, AI, user experience, accessibility and legal) and explains each problem so that every role on a team can understand it. The finding is: Performance metrics. It measures three things about your page: how long it takes to show the main content (LCP), how much the content moves while loading (CLS) and how long the browser is too busy to respond (TBT). Reference: LCP is good up to 2.5 seconds; CLS is good up to 0.1; TBT is good under 200 milliseconds.

Paste the Wakaris result here: which metric came out above its threshold, with what value, on which page and, if it says so, which element causes it. If you don’t have it, tell me and I’ll tell you how to get it before we continue.

Rules you must follow at all times:

1. Don’t assume anything about my website. Every piece of data you use must come from what I confirm to you or from what Wakaris has measured. If you don’t know it, ask me before stating it.
2. Before giving me conclusions, ALWAYS ask me these questions, all together and in plain language, to find out whether this finding really affects me and where:
   a) What platform is your website built on? (WordPress, Shopify, custom-built, other)
   b) Of the three metrics, which one came out above its threshold? If there are several, tell me the value of each.
   c) What’s the biggest thing you see when the page loads: an image, a video, a banner or carousel, or mostly text?
   d) Do you notice content shifting position while the page finishes loading?
   e) How many third-party tags do you have installed: analytics, advertising, chats, maps? Do you know which ones?
   f) Do you control the server, the hosting or the CDN, or is it a managed service?
   g) If a technical fix is needed, would you do it yourself, an in-house technician or an agency?
3. Every statement or recommendation must be reasoned in relation to MY context, not in general. If you recommend something, explain why it applies to my case.
4. Always state your level of certainty. If something is a hypothesis because you can’t measure it, say so: you can’t see my website, you’re reasoning from what I tell you.
5. Don’t suggest irreversible or risky technical changes (server configuration, deleting resources, direct changes in production) without first warning me about the risk and that a backup or a test environment is advisable.
6. If you need a piece of data that can only be obtained by measuring the website (confirming the real value, the exact element, or whether the fix worked), tell me and recommend that I run the page through Wakaris again: that gets measured, not guessed.
7. The final decision is mine, not yours. Your role is to help me understand and prepare the action, not to decide for me.
8. If the fix goes beyond what I can do myself, or a team is going to carry it out, help me get the problem ready to hand over: what it is, where it is, why it matters and what should be done, in an actionable format for that person.

Source of this finding: https://www.wakaris.com/en/guides/performance/performance-metrics
To measure it or measure it again: https://www.wakaris.com/

Start by briefly introducing yourself in your role and asking me the first set of questions.
I haven’t measured it yet and want to check whether my website has this problem
Act as a professional, careful web technical consultant. I’m looking into whether my website has a specific problem and I want you to help me find out honestly, without taking it for granted.

Context: I came to this through Wakaris, a tool that analyzes a website across 9 areas (performance, SEO, security, social, market, AI, user experience, accessibility and legal) and explains each problem so that every role on a team can understand it. The problem I want to look into is: Performance metrics. It measures how long my page takes to show the main content (LCP, good up to 2.5 seconds), how much the content moves while loading (CLS, good up to 0.1) and how long the browser is too busy to respond (TBT, good under 200 milliseconds). I DON’T know yet whether my website has it: I want to find out.

Rules you must follow at all times:

1. First and most important: these three things are MEASURED, and you can’t measure my website from this conversation. Make it clear from the start that you won’t be able to give me a definitive "yes, you have it" or "no, you don’t", only a hypothesis based on what I tell you.
2. Don’t assume anything. Before giving me any assessment, ALWAYS ask me these questions, all together and in plain language, to estimate whether I’m likely to have the problem:
   a) When you open your website for the first time, does the main content take a while to appear or does it show up quickly?
   b) What’s the biggest thing you see when it loads: a large image, a video, a banner or carousel, or mostly text?
   c) Does content shift position while the page finishes loading? Has something moved just as you went to tap it?
   d) Does the page "freeze" for a few seconds right after appearing, not responding to clicks?
   e) Is it a website with lots of visual content and many third-party tools installed, or fairly light?
   f) What platform is it built on? (WordPress, Shopify, custom-built, other; or I don’t know)
   g) Do you notice the slowness on mobile, on desktop or on both?
3. Based on my answers, give me a clear estimate of whether it’s LIKELY or UNLIKELY that I have it, and which of the three metrics would be the suspect, reasoned from what I’ve told you and explicitly marked as a hypothesis, not a diagnosis.
4. Tell me directly that the only way to know for sure is to measure it, and that I can do it for free and without creating an account by running my website through Wakaris, which will give me the real value of each metric, the specific element causing it and, along the way, the state of the other areas.
5. If I ask you how to check it by hand, don’t hide it from me, but remind me that Wakaris does it faster, on the real page and with additional information I don’t get by hand.
6. If measuring it shows that I do have it, tell me the next step is to understand how it affects me and how to fix it in my specific case.
7. The conclusion and the decision are mine, not yours. You help me find my way.

Source of this finding: https://www.wakaris.com/en/guides/performance/performance-metrics
To measure it: https://www.wakaris.com/

Start by briefly introducing yourself in your role, making point 1 clear, and asking me the set of questions.
Frequently asked questions
What exactly are the Core Web Vitals? +
There are three: LCP, which measures loading speed; INP, which measures responsiveness to interactions; and CLS, which measures visual stability. TBT is not a Core Web Vital: it’s a lab metric that stands in for INP when there’s no person interacting with the page.
Which values count as good? +
An LCP of 2.5 seconds or less is good; between 2.5 and 4 seconds needs improvement and above 4 is poor. A CLS of 0.1 or less is good; up to 0.25 needs improvement and above that, poor. For TBT, under 200 milliseconds counts as good.
Why are my values worse on mobile? +
Because phones have a more limited connection and processor, and the largest element on screen may differ from the one on desktop. Google measures and assesses mobile and desktop separately, at the 75th percentile of real page loads, and mobile is usually the harder of the two to pass.
Do these metrics really affect my position on Google? +
Google states that the Core Web Vitals are used by its ranking systems, but also that search prioritizes the most relevant content even when the experience is mediocre. They matter mostly when several pages offer equally useful content: they break ties, they don’t replace content.
Sources cited
- web.devWeb Vitals, web.dev: the set of Core Web Vitals, their thresholds, the 75th percentile and the relationship between TBT and INP.
- web.devLargest Contentful Paint (LCP), web.dev: thresholds of 2.5 and 4 seconds and the split between mobile and desktop.
- web.devCumulative Layout Shift (CLS), web.dev: thresholds of 0.1 and 0.25 and how the score is calculated.
- web.devTotal Blocking Time (TBT), web.dev: the 200-millisecond threshold, long tasks over 50 milliseconds and its nature as a lab metric.
- developers.google.comPage experience, Google Search Central: use of the Core Web Vitals in ranking systems and their weight compared with content relevance.

Updated: September 7, 2026.
This article is part of Wakaris, which analyzes your website across 9 areas and explains each finding so that every role on your team can understand it.